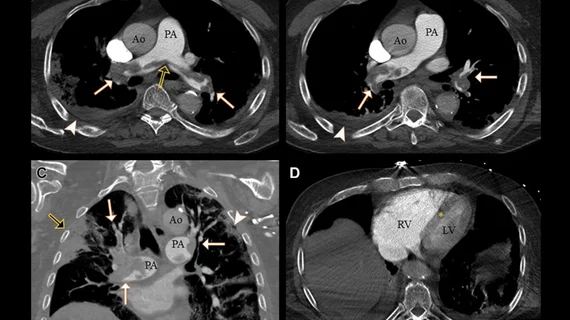
COVID causes increase risk of clotting. Example of a pulmonary embolism. CT pulmonary angiograms in a 77-year-old man with COVID-19 and a saddle embolus to pulmonary arteries (black arrow in A) extending into right and left pulmonary arteries (white arrows) in (A, B) axial and (C) coronal planes. Arrowheads show pulmonary changes associated with COVID-19 and possible lung infarction (black arrow in C). (D) Axial image at the level of the ventricles shows right-sided heart strain with interventricular septal flattening (*). Ao = aorta, LV = left ventricle, PA = pulmonary artery, RV = right ventricle. Image courtesy of RSNA. Read more.