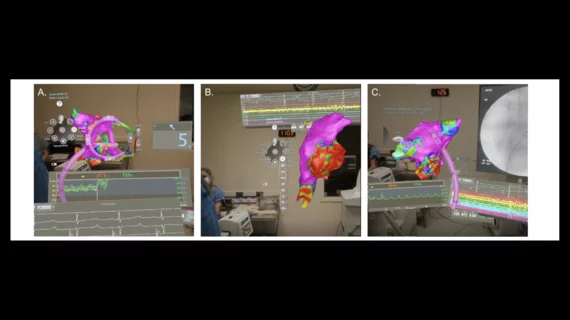
Panel A shows a large left atrial geometry with the menu ring fully expanded to the upper left corner of the map. To the right of the map is the force sensing screen with the force (in gms) and vector. Beneath the map, there is the ablation graph, with temperature (red), power (yellow) and impedance (green). The real time electrograms were placed beneath the ablation graph screen. Numeric ablation data is also present but layered behind the electrograms in the lower right-hand corner. Panel B shows a right atrial geometry with an expanded menu to the right of the map, and real time electrograms above the map. The numeric ablation parameter data was layered behind the map and above the electrograms. In panel C, there is a left atrial map with a fluoroscopic image to the right of the map, real time electrograms below the fluoroscopic image, below that are numeric ablation parameters layered beneath the electrograms and graphed ablation parameters below the map. Images and caption courtesy of Maher et al.